Sortable Bar Chart with D3.js
This chart is made based on Mike Bostock’s example code: https://observablehq.com/@d3/sortable-bar-chart#chart
I rewrote the code implementing my own logic. Let’s quickly understand the data behind this code before we dive into the steps of creating the chart.
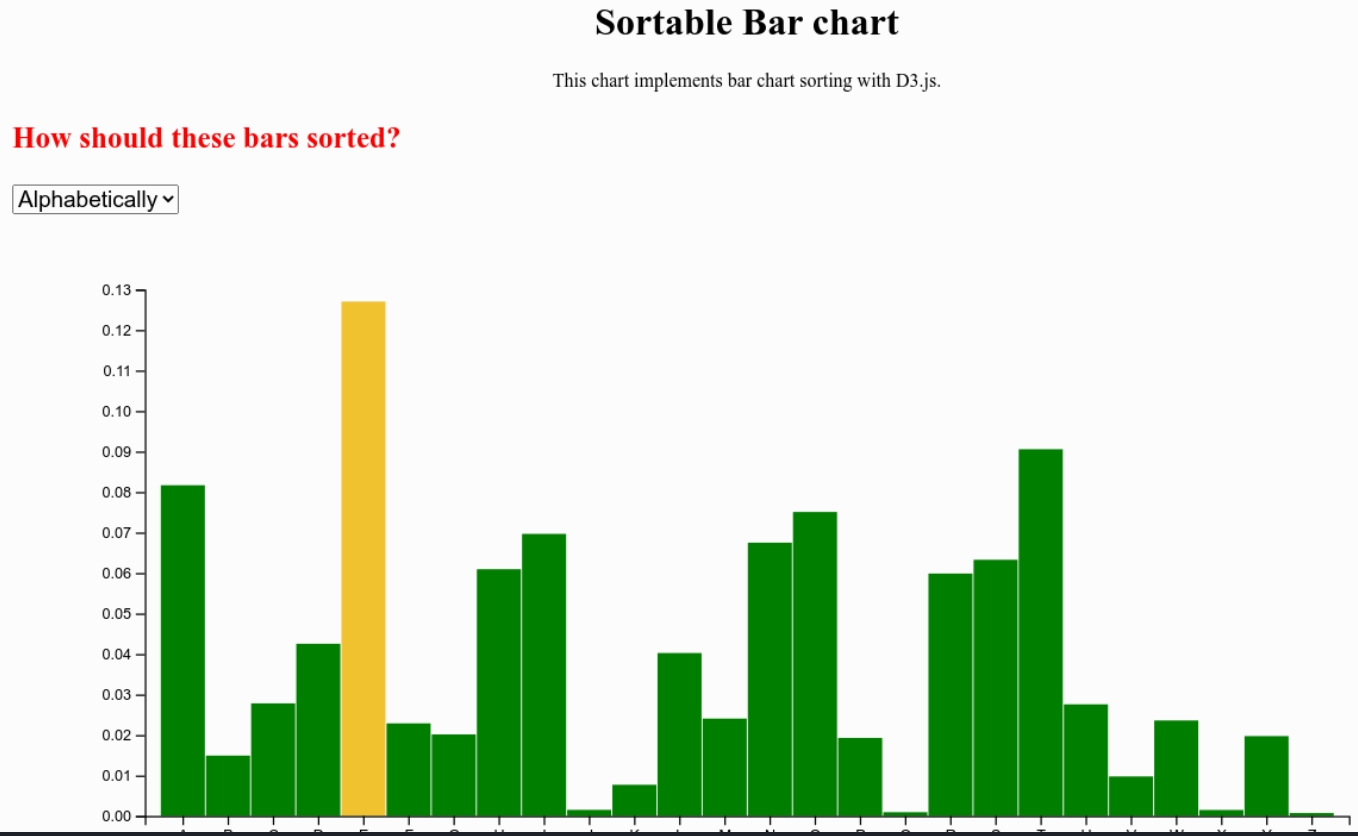
This is a small dataset with Alphabets and their frequency of usage in words.
Link to the dataset: https://gist.githubusercontent.com/learning-monk/96c71857dcfc348ecbcda5cb4a90163a/raw/69fa895f7b5f2d99d236762969c46b1a9c47604a/alphabet.csv
Components to be added:
- Add a container DIV which holds the SVG element and its contents
- Add a drop down select box which let’s you select the options to sort the bars
- Finally, add an SVG element where you draw your chart
Here is the complete code for creating this chart. I will explain each section as and when required.
HTML File: index.html
  <!DOCTYPE html>
  <html lang="en">
    <head>
      <meta charset="UTF-8" />
      <meta name="viewport" content="width=device-width, initial-scale=1.0" />
      <script src="https://d3js.org/d3.v5.min.js"></script>
      <link rel="stylesheet" href="style.css" />
      <title>Sorted Bar Charts</title>
    </head>
    <body>
      <h1 style="text-align: center">Sortable Bar charts</h1>
      <p style="text-align: center">
        This chart implements bar chart sorting with D3.js.
      </p>
      <div id="selectMe"></div>
      <div id="chartContainer"></div>
      <script src="script.js"></script>
    </body>
  </html>
If you observe in this HTML file, I have created two DIVs. One holds the drop down and other holds the SVG element.
CSS File: style.css
  .label {
    margin-left: 15px;
  }

  #selection {
    font-size: 19px;
    margin-left: 15px;
  }
This CSS file is styling the drop down and its label.
JavaScript File: script.js
  const w = 1000;
  const h = 500;

  const margins = { top: 50, left: 100, bottom: 100, right: 100 }
  const innerWidth = w - margins.left - margins.right;
  const innerHeight = h - margins.top - margins.bottom;

  url = "https://gist.githubusercontent.com/learning-monk/96c71857dcfc348ecbcda5cb4a90163a/raw/69fa895f7b5f2d99d236762969c46b1a9c47604a/alphabet.csv"

  d3.csv(url).then((data, error) => {
    if (error) throw error;

    data.forEach(d => {
      d.letter = d.letter;
      d.frequency = +d.frequency;
    });

    // Create a select dropdown
    const mySelection = document.getElementById("selectMe");

    d3.select(mySelection)
    .append("span")
    .append("p")
    .attr("class", "label")
    .text("How should these bars sorted?")
    .style("font-weight", "bold").style("color", "red").style("font-size", "25px");

    const selectItems = ["Alphabetically", "Ascendingly", "Descendingly"];

    // Create a drop down
    d3.select(mySelection)
      .append("span")
      .append("select")
      .attr("id", "selection")
      .attr("name", "tasks")
      .selectAll("option")
      .data(selectItems)
      .enter()
      .append("option")
      .attr("value", d => d)
      .text(d => d);

    // When the page loads, the chart which sorted alphabetically loads by default
    document.addEventListener("DOMContentLoaded", myChart());

    // Chart changes based on drop down selection
    d3.select("#selection").on("change", function() {
      const selectedOption = d3.select(this).node().value;
      if (selectedOption == "Ascendingly") {
        data.sort((a,b) => {
          return d3.ascending(a.frequency, b.frequency)
        })
      } else if (selectedOption == "Descendingly") {
        data.sort((a,b) => {
          return d3.descending(a.frequency, b.frequency)
        })
      } else if (selectedOption == "Alphabetically") {
        data.sort((a,b) => {
          return d3.ascending(a.letter, b.letter)
        })
      }
      myChart();
    })

    function myChart () {
      // Append SVG to this DIV
      const chartDIV = document.createElement("div");

      // Create scales
      const xScale = d3.scaleBand()
      .domain(data.map((d) => d.letter))
      .rangeRound([0, innerWidth])
      // .round(true)
      .paddingInner(0.05);

      const yScale = d3.scaleLinear()
        .domain([0,d3.max(data, d => d.frequency)]).nice()
        .range([innerHeight, 0]);

      const xAxis = d3.axisBottom().scale(xScale);

      const yAxis = d3.axisLeft().scale(yScale);

      const svg = d3.select(chartDIV)
        .append("svg")
        .attr("viewBox", [0,0,w,h]);

      const mainG = svg
        .append("g")
        .attr("transform", `translate(${margins.left}, ${margins.top})`);

      const g = mainG
        .selectAll("g")
        .data(data)
        .enter()
        .append("g")
        .attr("transform", `translate(15,0)`);

      g.append("rect")
        .attr("class", "bars")
        .attr("x", d => xScale(d.letter) - innerWidth/data.length/2)
        // .attr("x", (d,i) => i*(innerWidth/data.length))
        .attr("y", d => yScale(d.frequency))
        .attr("width", innerWidth/data.length-1.5)
        .attr("height", (d) => innerHeight - yScale(d.frequency))
        .attr("fill", d => d.frequency == d3.max(data, d => d.frequency) ? "#f4c430" : "green")
        .append("text")
          .attr("x", 5*3)
          .attr("y", (d,i) => i*5)
          .text(d => d.frequency);

      mainG
        .append("g")
        .call(xAxis)
        .attr("transform", `translate(0, ${innerHeight})`);

      mainG
        .append("g")
        .call(yAxis);

      // This code will redraw charts based on dropdown selection.
      // At any point in time, chartContainer DIV only contains one chart.
      // The charts are recycled.
      const showChart = document.getElementById("chartContainer");
      while (showChart.firstChild) {
        showChart.firstChild.remove();
      }
      showChart.appendChild(chartDIV);

    }

  });
This D3.js code can be broadly divided into blocks as shown below.
- Load Data
- Transform data
- Create a drop down with values
- Create scales
- Create SVG
- Add chart elements to SVG
- Append SVG to Chart container DIV
- Write functions to render charts for Load and Change events.
Most of the steps mentioned above are common for D3.js charts. So, I am not going in depth of each step. However, I want to particularly highlight the Load and Change events associated with this chart.
When the chart loads, a default chart is displayed ie., bars in alphabetical order.
document.addEventListener("DOMContentLoaded", myChart());myChart() is a function which is template to draw chart.
When a user changes the selection from the drop down, charts based on the selection gets rendered. This is when Change event kicks in.
      d3.select("#selection").on("change", function() {
      const selectedOption = d3.select(this).node().value;
      if (selectedOption == "Ascendingly") {
        data.sort((a,b) => {
          return d3.ascending(a.frequency, b.frequency)
        })
      } else if (selectedOption == "Descendingly") {
        data.sort((a,b) => {
          return d3.descending(a.frequency, b.frequency)
        })
      } else if (selectedOption == "Alphabetically") {
        data.sort((a,b) => {
          return d3.ascending(a.letter, b.letter)
        })
      }
      myChart();
    })
This piece of code sorts the underlying data based on user selection and that data is passed on to myChart() to draw the chart.
Recycling happens at the end of the code where SVG along with its chart elements gets changed based on user selection. Similar to blackboard where the previous notes is erased and fresh notes is drafted.
Hope this article helped you in understanding the logic behind sorting bars in a bar chart.
Feel free to reach out to me if you have any questions.
Note: If you would like to see this chart live in action. Access this codepen: https://codepen.io/ksp585/full/VwjgwoO